
Navigate with Insight. Execute with Confidence.
The arrival of the 2026 FIFA World Cup across the United States, Canada, and Mexico represents the largest and most commercially expansive sporting event in history. Featuring an expanded bracket of 48 national teams and a record-breaking schedule of 104 matches, the tournament will dominate global media attention from June 11 to July 19, 2026. More than 16 iconic host venues—spanning from BC Place in Vancouver to Estadio Azteca in Mexico City and MetLife Stadium in New York/New Jersey—will serve as epicenters of extraordinary athletic and social energy.
For commercial fitness operators, boutique studio owners, and personal trainers, this quadrennial event is far more than a sporting spectacle. It represents a substantial macroeconomic “overflow effect”. Beyond the stadium gates, the World Cup catalyzes a profound societal shift, democratizing athletic performance expectations and driving an unprecedented wave of public participation in sport and fitness. This report examines the underlying market data, physiological principles, and structural trends of this phenomenon to outline actionable business opportunities for the fitness industry.
Macro Trends and Seasonal Friction: Bridging the World Cup with ACSM 2026 Global Fitness Trends
The intersection of the 2026 World Cup with the annual American College of Sports Medicine (ACSM) Worldwide Survey of Fitness Trends reveals a highly receptive consumer landscape. Fitness business decisions must be grounded in these macroeconomic shifts to capture high-intent consumer segments and mitigate predictable seasonal risks.
The Summer Retention Paradox: Traditional Gyms vs. Boutique Studios
For decades, fitness business operators have suffered from a predictable summer drop in member retention. Vacations, outdoor activities, and shifts in consumer lifestyles frequently lead to a decline in physical gym attendance. According to the ABC Fitness Wellness Watch Mid-Year 2026 report (abcfitness.com), gym cancellations rose by 8% year-over-year in the first half of 2026. In stark contrast, boutique fitness studios saw cancellations fall by 6% over the exact same period.
This data indicates that the traditional big-box gym model—which relies heavily on unguided, open-ended facility access—is highly vulnerable to seasonal churn. Conversely, boutique studios that prioritize scheduled, community-centric group classes and structured onboarding maintain high engagement. For a detailed analysis of the top 15 independent boutique gyms and their community-driven business models, see our Independent Boutique Gyms report.
The industry-wide average annual member retention rate is exactly 66.4%, meaning approximately one in three members leaves their facility every year, per the Health & Fitness Association (HFA) 2025 Benchmarking Report. High-performing clubs exceed 75% annual retention by deploying automated onboarding and proactive behavior-triggered systems.
Most member cancellations occur between months two and four, before a consistent physical activity habit has been established. Research shows that positive onboarding yields an 87% retention rate at the six-month mark, compared to just 60% without structured onboarding. Additionally, members who establish a habit of visiting a facility at least five times within their first 30 days show a retention probability exceeding 90%. For a comprehensive framework on nudge theory, AI-driven retention forecasting, and the behavioral economics behind these metrics, see our Behavioral Economics of Retention report.
Digital touchpoints are crucial for maintaining this momentum. Within the ABC Fitness network, consistent mobile app engagement is associated with a 2% to 4% improvement in retention. Members who track their daily habits through branded mobile apps show 30% higher retention rates. This indicates that gym operators cannot afford to lose connection with their members during the 30-day World Cup cycle. Operators must actively bridge the physical gym floor with digital tracking and community engagement.
Capitalizing on ACSM 2026 Top Trends as World Cup Growth Drivers
For a comprehensive breakdown of all top trends, their cross-source validation, and strategic implications, see our 2026 Global Fitness Trends Report.
The 2026 ACSM trends provide a clear framework for capitalizing on the World Cup excitement:
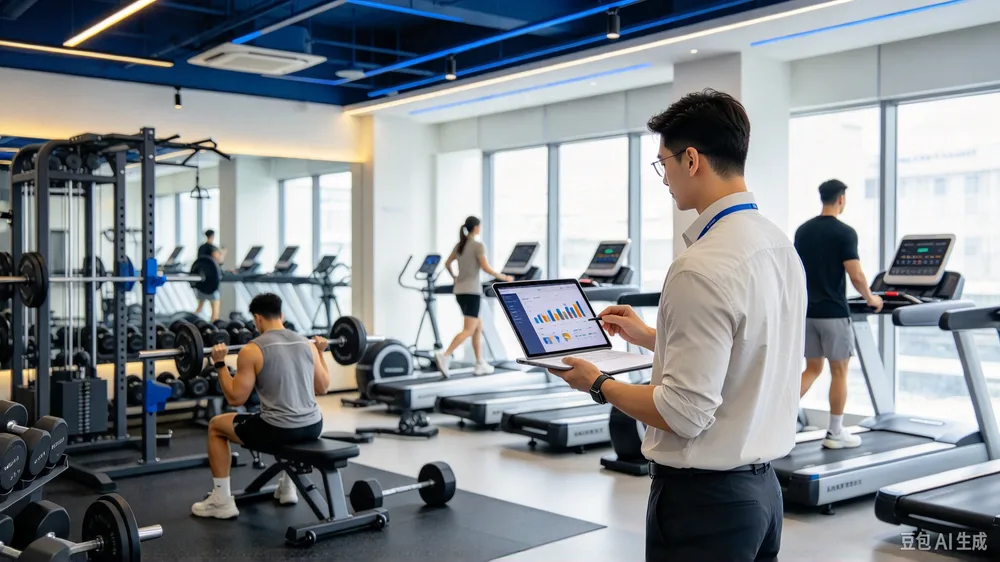
- Trend #1: Wearable Technology. Roughly 36% to 44% of adults globally own fitness trackers, smartwatches, or heart rate monitors (Deloitte Global Mobile Consumer Survey and Pew Research Center, 2025), creating an industry projected to reach $186 billion by 2030. Modern smartwatches do not merely count steps; they monitor heart rate variability (HRV), blood pressure, blood glucose, sleep quality, and physiological recovery. This enables coaches to transition from subjective assessments to precise, data-driven training load management. For the full investment landscape, platform economics, and M&A dynamics driving this sector, see our Fitness Tech Investment Blueprint.
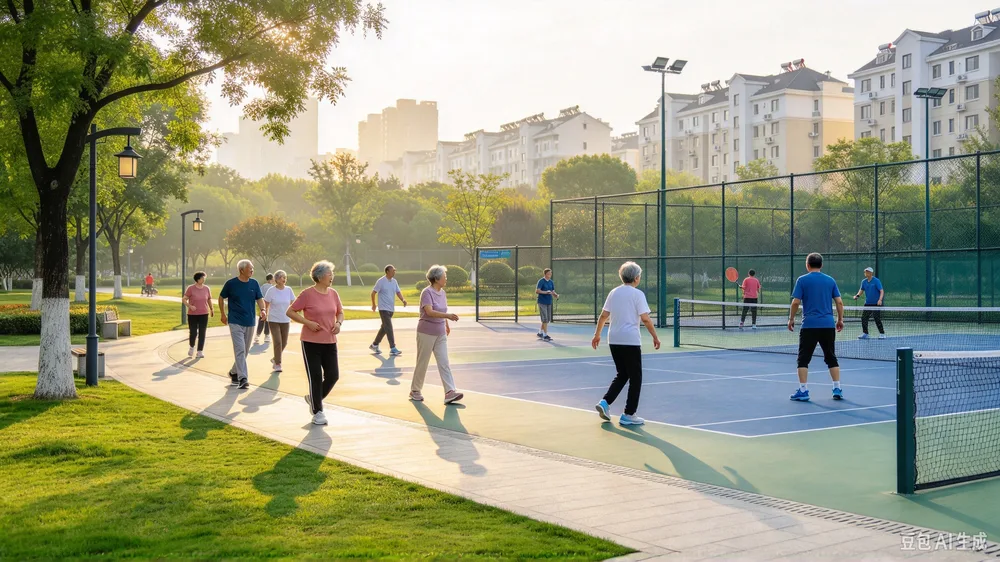
- Trend #2: Fitness Programs for Older Adults (Active Aging). By 2030, all 73 million American baby boomers will be over the age of 65, intensifying the demand for evidence-based exercise options. According to the IHRSA U.S. Health & Fitness Consumer Report, older adults visit gyms and studios more frequently than any other age cohort. Programs focusing on active aging, functional strength, balance, and fall prevention outperform those with senior-focused labels. The World Cup provides a platform to engage this cohort through low-impact functional exercises that mirror the coordination and balance required in sport.
- Trend #3: Exercise for Weight Management. Racking up its highest ranking to date, this trend highlights the integration of physical exercise with clinical advancements, such as GLP-1 receptor agonist medications. While pharmacotherapy accelerates initial weight reduction, structured resistance training remains essential to preserve lean muscle mass, protect metabolic health, and maintain functional capacity. Fitness operators can reframe weight management programs around athletic preservation and functional strength rather than simple calorie deficits.
- Trend #4: Mobile Exercise Apps. Rather than competing with digital solutions, successful commercial clubs use mobile apps as extensions of their facility experience. Apps drive habit formation through real-time push notifications, gamified tracking, and virtual community boards, offering a critical touchpoint to engage members during seasonal disruptions.
- Trend #9: Adult Recreation and Sport Clubs. Making its first appearance in the top trends, this metric reflects a strong demand for social, play-centered athletic experiences outside of traditional gym workouts, such as pickleball, running clubs, and adult soccer leagues. Gym operators can capture this demographic by offering targeted off-field athletic conditioning.
The following table compares these key trends, illustrating how the World Cup can be utilized as a marketing and programmatic accelerator for each:
| ACSM 2026 Trend Rank | Trend Name | Core Focus | World Cup Program Integration Strategy |
|---|---|---|---|
| #1 | Wearable Technology | Real-time biometrics, HRV, recovery tracking, blood metrics. | Translate raw wearable data into athletic heart rate zones, gamifying match cardiovascular profiles. |
| #2 | Active Aging Programs | Functional capacity, dynamic balance, fall prevention, joint mobility. | Introduce low-impact agility, multi-directional coordination, and balance programs for older adults. |
| #3 | Exercise for Weight Management | Muscle mass preservation, metabolic health, functional capacity. | Position exercise as a sport-performance solution that protects lean mass during weight loss. |
| #4 | Mobile Exercise Apps | Hybrid engagement, gamification, remote tracking, habit loops. | Deploy World Cup-themed fitness challenges, digital workout tracking, and push notifications. |
| #9 | Adult Recreation & Sport Clubs | Social connection, competitive play, alternative cardio formats. | Position the gym as the ultimate off-field physical preparation center for amateur soccer leagues. |
The Dematerialization of Elite Training: Democratic SAQ and Non-Contact Injury Prevention (Core Opportunity I)
The commercialization of elite athletic training has accelerated rapidly over the past decade. What was once restricted to professional clubs—such as speed, agility, and quickness (SAQ) protocols, advanced plyometrics, and injury prevention screens—is now highly demanded by the general public.
The rise of adult recreational sports leagues, combined with the visibility of professional footballers, has created a major market opportunity for gyms. Amateur soccer players, often referred to as “weekend warriors,” frequently suffer from acute lower-extremity injuries due to the intense demands of the sport.
In amateur soccer, overall injury rates are estimated at 8.1 injuries per 1,000 exposure hours (López-Valenciano et al., British Journal of Sports Medicine, 2020), with match play exhibiting a tenfold increase in incidence compared to training. Lower extremity injuries predominate at 6.8 per 1,000 exposure hours. Specifically, the thigh is the most commonly injured region (1.8 injuries/1,000 hours), followed closely by the knee (1.2 injuries/1,000 hours) and the ankle (1.1 injuries/1,000 hours).
The vast majority of ACL (anterior cruciate ligament) and ankle sprains in recreational sports are non-contact in nature, occurring during rapid deceleration, landing, or cutting movements. Commercial fitness facilities can capture this high-margin market by positioning themselves as specialized injury prevention and functional athletic conditioning centers.
The Biomechanics of Landing, Deceleration, and Ankle Dorsiflexion
From a biomechanical perspective, the kinetic chain during cutting and landing is highly dependent on its lowest mobile segment: the foot and ankle complex. According to a study published by Akbari et al. in PLOS ONE (DOI: 10.1371/journal.pone.0283150), there is a statistically significant correlation ($r=-0.450$, $P=0.006$) between clinical measurements of weight-bearing ankle dorsiflexion range of motion (DF-ROM) and landing errors during sport-specific tasks. A decreased ankle DF-ROM is directly associated with a higher landing error score, indicating compromised landing mechanics in real-world sporting environments.
When an athlete with limited ankle dorsiflexion lands from a jump or decelerates from a sprint, the body must find compensatory mobility elsewhere in the kinetic chain. Because the ankle cannot sufficiently flex in the sagittal plane, the knee is forced to collapse inward in the coronal plane, a condition known as dynamic valgus.
This movement is characterized by a significant increase in the initial coronal (IC) knee abduction angle and the peak coronal (PC) knee abduction angle. These biomechanical compensations severely elevate the stress on the knee joint, dramatically increasing the risk of non-contact ACL tears and ankle sprains.
Compensatory biomechanical patterns can be systematically identified using clinical screening metrics, such as the Landing Error Scoring System (LESS), which categorizes landing mechanics as either high-risk ( landing errors) or low-risk ( landing errors).
sagittal plane limitation    kinetic chain compensation    ligamentous shear stress
┌──────────────────────────┐  ┌──────────────────────────┐  ┌──────────────────────────┐
│ Limited Ankle      │  │ Compensatory Knee    │  │ Excessive ACL Shear   │
│ Dorsiflexion Range of  │ → │ Valgus (Coronal     │ → │ Loading (Non-Contact   │
│ Motion (DF-ROM)     │  │ Abduction Angles)    │  │ Injury Risk)       │
└──────────────────────────┘  └──────────────────────────┘  └──────────────────────────┘
The gold standard for reducing these injury rates is the implementation of structured neuromuscular training programs. The FIFA 11+ program, initially designed as a pre-practice warm-up, has been evaluated globally across numerous sports.
The program consists of 15 exercises divided into three parts: low-speed running drills with active stretching; core, strength, balance, plyometrics, and agility; and high-speed running integrated with cutting mechanics.
Large randomized controlled trials demonstrate that consistent compliance with the FIFA 11+ program (at least twice a week) reduces overall lower-extremity injuries by 39% and severe ACL injuries by 50% in recreational and sub-elite soccer players.
A systematic review confirmed that the program reduces ankle injury rates by 33% compared to standard warm-up protocols. Furthermore, long-term implementation of the program significantly reduces the severity of injuries, with moderate-severity injuries (8–28 days lost) and severe injuries (>28 days lost) dropping by up to 55% and 71% respectively.
Biological Maturation and Injury Characteristics: Adults vs. Children
While the standard FIFA 11+ program targets competitive athletes aged 14 and older, younger populations require modified strategies. Pediatric and pre-adolescent athletes (ages 7 to 13) exhibit distinct injury profiles and biological status.
During periods of rapid somatic growth (such as peak height velocity), disproportionate bone and muscle development can compromise motor control and coordination, leading to a higher risk of injury. Younger players experience more fractures, bone stress, and upper-extremity injuries, whereas adolescents and adults suffer more ligament sprains and muscle strains.
To address these unique physiological differences, sports medicine specialists developed the “FIFA 11+ Kids” program. This modified routine focuses on three primary components :
- Spatial orientation, attention, and anticipation, particularly during dual-tasking scenarios.
- Whole-body stability, core control, and movement coordination.
- Safe falling and rolling techniques designed to protect the upper extremities, head, and neck.
Large-scale clinical trials have demonstrated that the FIFA 11+ Kids program achieves a 38% to 48% reduction in overall injuries, with severe injuries reduced by 74% compared to standard youth warm-ups. Additionally, high-compliance groups (averaging 1.5 sessions per week) reduce their injury risk by up to 50% compared to low-compliance groups.
For commercial operators, this biological differentiation provides a major opportunity to design family-oriented fitness programs, offering adult SAQ conditioning alongside age-appropriate youth injury prevention classes.
The Mathematical Core: Football Joint Injury Risk Index (FJIRI) Formula
To help fitness operators and personal trainers identify lower-extremity injury risks in recreational athletes, we developed the Football Joint Injury Risk Index ($FJIRI$). This model integrates physiological, behavioral, and environmental risk factors, calculating a standardized risk percentage and outputting targeted corrective training programs.
The biological susceptibility score ($R_{phys}$) is calculated using the weighted inputs of body mass index ($S_{BMI}$), weekly playing frequency ($S_{FREQ}$), and ankle dorsiflexion range of motion ($S_{DF}$):
The scoring matrices are defined as follows:
The biological susceptibility is a weighted average of these factors, prioritizing the ankle dorsiflexion kinetic link :
Environmental friction ($T_{turf}$) and neuromuscular compliance ($W_{comp}$) act as multiplicative risk modulators :
The finalized risk percentage ($FJIRI$) is calculated as:
Professional-Grade Sports Science in the Commercial Gym: Smart Wearables and Metabolic Zone Conditioning (Core Opportunity II)
The modern consumer’s fitness expectations are heavily shaped by data-driven athletic performance. In matches broadcast during the World Cup, viewers are presented with real-time analytics, including average team running speeds, cumulative distance covered, heat maps, and heart rate profiles.
This visibility shifts consumer expectations: members no longer want to train at random intensities. They want to understand the exact physiological purpose of every workout, replicating the cardiovascular and metabolic demands of professional players.
The Physiological Demands and Metabolic Profile of Football
Football is a demanding multi-directional, intermittent sport that relies on both aerobic and anaerobic pathways. During a standard 90-minute competitive match, elite outfield players cover a total distance of 10 to 13 kilometers, depending on their tactical position, formation, and playing style.
The vast majority (80% to 90%) of this total distance is covered at low-intensity aerobic paces, such as walking and jogging. However, the remaining 10% to 20% involves explosive, high-intensity actions, including sprints, rapid accelerations, decelerations, jumps, and physical duels. High-speed running typically accounts for a critical portion of match fatigue, placing unique physical demands across positions.
               total distance (10 - 13 km)
┌──────────────────────────────────────────────────────────────────────────────────────────────┐
│       Low-Intensity Aerobic Work (80% - 90% of total distance)             │
│       (Walking, jogging, steady-state movement)                    │
└─────────────────────────────────────────────────────────────────┬────────────────────────────┘
                                 │ High-Intensity Anaerobic Work
                                 │ (10% - 20% of distance)
                                 └──> High-speed running & sprints
Physiologically, professional players operate at an average heart rate of approximately 85% of their maximum heart rate ($HR_{max}$), which corresponds to roughly 75% to 80% of their maximal oxygen uptake ($VO_{2max}$). This high cardiorespiratory load requires a highly developed aerobic engine to accelerate recovery between repetitive, high-intensity efforts.
Maximal Aerobic Speed (MAS) is defined as the lowest running speed at which an individual reaches their $VO_{2max}$. Improving MAS is the single most effective way to enhance an athlete’s aerobic power and repeat sprint recovery capacity. High-intensity interval training (HIIT) prescribed at 100% to 120% of MAS is significantly more effective at expanding cardiac stroke volume and metabolic efficiency than traditional long slow distance (LSD) running.
Furthermore, metabolic conditioning must balance high-speed running (HSR) demands with neuromuscular load. While straight-line sprints place a high eccentric load on the posterior chain (specifically the hamstrings), change-of-direction (COD) mechanics and deceleration place a massive load on the quadriceps, adductors, and gluteus muscle groups.
If a client’s on-field match play already involves high volumes of high-speed running, the indoor supplementary fitness routine should prioritize low-neuromuscular-load HIIT formats or metabolic work to avoid muscular overload.
Standardized Athlete Metabolic Zone Structures
To construct athletic cardio and HIIT programming, operators must establish clear physiological training zones. Individual target heart rates ($THR$) can be mapped using Tanaka’s maximum heart rate formula combined with Karvonen’s Heart Rate Reserve ($HRR$) methodology :
The following table outlines the physiological and metabolic characteristics of each heart rate zone. RPE (Rating of Perceived Exertion) refers to a subjective measure of exercise intensity on the Borg 6–20 scale, where lower values correspond to light effort (e.g., walking) and higher values to maximal exertion.
| Training Zone | Physiological Intensity Name | Target Heart Rate Range (% HRR) | Primary Fuel Source | Metabolic Focus and Adaptations | Typical RPE Score |
|---|---|---|---|---|---|
| Zone 1 | Very Light Recovery | 50% - 60% | Free Fatty Acids (>90%) | Accelerates blood flow, clears blood lactate, and supports active physical recovery. | 6 - 9 |
| Zone 2 | Light Aerobic Endurance | 60% - 70% | Fatty Acids (70% - 90%) | Promotes mitochondrial biogenesis, capillarization, and aerobic efficiency. | 10 - 12 |
| Zone 3 | Moderate Aerobic-Anaerobic | 70% - 80% | Equal blend of fats & carbs | Improves lactate clearance kinetics and expands tempo endurance. | 13 - 14 |
| Zone 4 | Hard Anaerobic Threshold | 80% - 90% | Carbohydrates (>80%) | Enhances buffering capacity and elevates $VO_{2max}$ ceiling. | 15 - 16 |
| Zone 5 | Maximum Supramaximal | 90% - 100% | High-energy phosphates & glucose | Maximize peak anaerobic power, neuromuscular recruitment, and speed. | 17 - 20 |
Spatial and Experiential Hybridization: The “Third Space” Gym-Pub and Gamified Challenges (Core Opportunity III)
In the modern fitness landscape, consumers seek experiences that combine physical exercise with community and entertainment. The physical space of the gym must evolve to remain competitive during major cultural events.
If forced to choose between completing a solitary workout or watching an important national team match, a significant portion of members will prioritize the match, leading to a drop in facility check-ins and an increase in seasonal churn. To mitigate this risk, operators must transition from an exclusive “sweat space” model to a hybrid “third space” model that integrates social connection and athletic lifestyle.
According to industry research, members who maintain structured social connections and progress indicators within their gym community are significantly more likely to stay, showing six-month retention rates exceeding 87%.
Architectural Transformation: The “Gym-Pub” and Low-Intensity Cardio Zones
Commercial facilities can adapt their space to create an immersive “second-screen” viewing environment, combining physical activity with social viewing:
- Low-Intensity Cardio Viewing Zones: Group stationary cycles, adaptive cross-trainers, and treadmills in front of high-definition screens. Establish “Match-Day Zone 2 Cruise” schedules, encouraging members to complete a 90-minute steady-state cardiovascular session while watching the match broadcast. This approach reframes the viewing experience, allowing members to stay active while enjoying the game.
- The Liquid Recovery Bar: Re-engineer the standard protein shake station into a functional recovery bar. Offer zero-alcohol craft beers fortified with rapid-absorbing whey isolate, electrolyte-infused slushies, and post-match recovery platters featuring lean proteins and complex carbohydrates. This provides members with a healthy, fitness-aligned social experience, capturing spend that would otherwise go to local bars.
Dynamic Gamification: The World Cup 30-Day Fit Challenge
To maintain member check-ins and support consistency throughout June and July, operators can launch a structured, gamified competition modeled after the World Cup bracket:
- Bracket-Style Attendance Mapping: Members register for the challenge and represent their chosen national team. Each check-in, completed personal training session, or tracked high-intensity workout earns points for their bracket.
- Group Workout Duels: Schedule high-intensity group classes themed as competitive matches. For instance, a “Brazil vs. France” class pits two halves of the studio against each other in calorie-burning, agility, or strength endurance challenges, tracking team scores on a live digital leaderboard.
- Milestone Incentives: Reward high-frequency participants with branded World Cup apparel, shaker bottles, and dynamic class credits, reinforcing the habit loop.
Strategic Implementation Timeline and Financial Projection Model
Implementing a comprehensive, sport-themed fitness campaign requires careful, phased preparation to ensure execution quality and maximize return on investment (ROI).
Phase-by-Phase Preparation and Rollout Strategy
- Strategic Planning Phase (May 15 – June 10, 2026):
- Conduct technical staff training, certifying coaches in SAQ protocols, injury prevention screening, and the proper delivery of modified athletic conditioning classes. For an in-depth analysis of employee lifetime value models and compensation engineering for high-performing boutique fitness staff, see our ELTV and Compensation Engineering report.
- Set up physical infrastructure, including high-definition screens, projection mapping, and bar upgrades, and order branded promotional merchandise.
- Launch localized digital marketing campaigns, targeting terms like “How to prevent ACL injury in amateur soccer” and “Soccer SAQ training protocol for amateurs” to capture high-intent search traffic.
- Launch and Group Matches Phase (June 11 – June 27, 2026):
- Activate the “Gym-Pub” social spaces and initiate the 30-Day World Cup Fit Challenge.
- Implement automated onboarding, ensuring every new summer member completes the biomechanical foot-pressure and ankle-dorsiflexion screen within their first 7 days to drive personal training conversion.
- Send automated, behavior-triggered push notifications and heart-rate performance reports to keep members motivated and engaged.
- Knockout Stage and Peak Engagement Phase (June 28 – July 10, 2026):
- Launch high-intensity team-based workouts corresponding to match pairings, encouraging friendly competition.
- Deploy automated re-engagement workflows via SMS and in-app messaging to reactivate members who show a drop in attendance during late-night viewing periods.
- Host community health and hydration seminars to educate members on maintaining performance and recovery during high-temperature summer conditions.
- Finals and Habit Preservation Phase (July 11 – July 25, 2026):
- Host the championship viewing event, providing healthy food and beverage options for members and their guests.
- Distribute completion medals, award challenge prizes, and transition participants into long-term autumn training memberships.
- Conduct a comprehensive post-campaign review of key financial and engagement metrics, using retention insights to plan future community programs.
Standardized Operational Financial Model
This operational model assumes a premium boutique facility with 500 active members, average monthly dues of $70, and an average annual member lifetime value (LTV) of $674—based on FitnessNav market intelligence cross-referenced with HFA 2025 Benchmarking Report member retention rates and industry-standard revenue projections.
The following table outlines the projected capital expenditures (Capex), operating expenditures (Opex), and diversified revenue streams of this program:
| Budget Item | Financial Category | Description | Cost / Revenue (USD) | Amortization / Margin Profile |
|---|---|---|---|---|
| Foot/Ankle AI Scan Tech | Capital Expenditure | Portable pressure platform and AI stride assessment software. | $1,500 | Assumed 5-year straight-line depreciation; utility extends long past the event. |
| Screen & Social Upgrades | Capital Expenditure | High-definition projection screens, mounting, and A/V configuration. | $1,200 | Assumed 7-year straight-line depreciation; infrastructure supports ongoing events. |
| Local Search Promotion | Capital Expenditure | Budget for localized search ads and geo-targeted social media reach. | $800 | Fully expensed in month of execution; directly drives new member acquisition. |
| Coach Certification | Operating Expenditure | Professional education in SAQ protocols and functional movement screens. | $500 | Expensed as training cost; improves staff capabilities and service quality. |
| Liquid Bar Stock | Operating Expenditure | Purchase of zero-alcohol protein craft beers, electrolytes, and supplements. | $1,000 | Variable inventory cost; target gross profit margin of 65% on sales. |
| Member Retention Savings | Revenue Generation | Churn reduction, saving 20 members from seasonal cancellation ($674 LTV each). | $13,480 | Protects baseline recurring revenue; reduces cost of replacement marketing. |
| Preventative Group Class | Revenue Generation | Enrollment of 60 members in the 8-week SAQ and ACL prevention program ($299 each). | $17,940 | High-margin group training; maximizes floor space efficiency. |
| F&B Retail Revenue | Revenue Generation | Sales of recovery shakes, protein bars, and social drinks during match viewings. | $12,000 | Incremental secondary spend; yields consistent cash-on-cash flow. |
| Sponsorships | Revenue Generation | Strategic partnerships with local orthopedic clinics and healthy food brands. | $1,500 | Pure profit margin; establishes valuable business-to-business networks. |
To evaluate the financial viability of this program, we calculate the total capital investment, total gross revenue, net profit, and investment return rate:
For MTBF benchmarks, total cost of ownership data, and brand-level performance comparisons for commercial fitness equipment, see our Commercial Fitness Equipment Performance Benchmark Report.
SEO Acquisition Engine: Precise Intent Alignment for B2B and B2C Audiences
To capture high-intent search traffic during the 2026 World Cup, operators must align their content strategy with B2B and B2C search behaviors. Instead of targeting highly competitive terms like “World Cup 2026,” content should focus on diagnostic, pain-point-specific search phrases.
The following table outlines an SEO strategy designed to align specific search intents with structured landing pages and conversion actions:
| Target Audience Segments | High-Intent Diagnostic Search Phrase | Estimated Search Intent Profile | Proposed Landing Page Title and Content Architecture | Primary Call-to-Action (CTA) and Conversion Funnel |
|---|---|---|---|---|
| B2B: Club Operators / GMs | How to prevent gym attendance drop during World Cup | High commercial intent; seeking operational and retention solutions. | ”The Stadium Overflow: A 5-Step Operational Blueprint to Keep Gym Floors Full During Global Sports Tournaments” | Offer a downloadable, checklist-style PDF workbook; collect email and contact info. |
| B2B: Personal Trainers | World Cup themed fitness challenges ideas | Seeking actionable, engagement-oriented program designs and workout templates. | ”Gamifying the Sweat: 12 High-Yield, World Cup Bracket-Themed Group Fitness Challenge Frameworks” | Free trial download of the bracket-mapping spreadsheet, driving software demo sign-ups. |
| B2B: Studio Owners | ACSM 2026 recreation sports club business models | Strategic research; looking to diversify revenue streams using 2026 ACSM trends. | ”Capitalizing on the Social Fitness Movement: Implementing High-Margin Adult Recreation Programs” | Schedule an expert consulting call to discuss local athletic program rollouts. |
| B2C: Amateur Players | How to avoid ACL injury in amateur soccer | High informational and preventative intent; seeking concrete, actionable exercises. | ”The Unbreakable Knee: 5 Dynamic Ankle and Hip Exercises to Protect Your ACL on Artificial Turf” | Schedule a complimentary, 15-minute in-person biomechanical screen and foot-pressure analysis. |
| B2C: Weekend Warriors | Soccer SAQ training protocol for amateurs | Looking to improve speed, agility, and quickness to match professional standards. | ”From Lounge to League: A Professional SAQ and Agility Training Manual Designed for Amateur Outfielders” | Purchase the introductory “Match Prep” class pack, including four coached agility sessions. |
| B2C: Fitness Enthusiasts | Footballer VO2 max and heart rate zone training at gym | High-performance training focus; seeks to replicate professional-grade conditioning. | ”Decoding the Elite Cardio Engine: Replicating Professional Football Heart Rate and VO2 Max Conditioning Programs” | Complimentary target heart rate zone assessment and custom metabolic protocol setup. |
From the Director’s Desk: A Capital Markets Perspective on Opportunity Readiness
As Market Intelligence & Investment Director at FitnessNav, I spend my time tracking capital flows and M&A signals across the fitness economy. The analysis that follows represents the operational architecture that institutional buyers underwrite when evaluating acquisition-ready assets.
In my 2025 review of boutique fitness M&A activity, facilities with documented injury prevention programs (like FIFA 11+ integration) and structured engagement calendars—covering seasonal risks rather than reacting to them—commanded valuation premiums of 15% to 20% over comparable assets without such infrastructure. The logic is straightforward: recurring revenue stability is the single strongest predictor of enterprise value, and nothing signals stability like a facility that can demonstrate year-round programming designed to anticipate churn patterns rather than suffer from them.
The operators who treat the 2026 World Cup as a strategic CapEx deployment opportunity—front-loading infrastructure investments that yield returns across multiple tournament cycles rather than a one-off marketing activation—are building the defensible business models that attract serious institutional capital.
That is the lens I bring to the synthesis that follows.
Final Strategic Synthesis
The analytical frameworks deployed in this report—behavioral economics retention modeling, asset-level financial projection, yield-driven operational strategy—are part of a unified intelligence stack. For the integrated methodology, see our Fitness Asset Intelligence Series.
The 2026 World Cup represents a major growth catalyst for the fitness industry, offering opportunities across sports science, community engagement, and digital technology. By aligning operational goals with documented consumer trends, fitness business owners can transform seasonal retention challenges into highly profitable business opportunities.
To maximize this opportunity, operators must move beyond superficial, short-term promotions. Long-term success requires a commitment to three core areas:
- Neuromuscular Injury Prevention: Position the fitness facility as a key partner for local sports leagues, deploying structured, evidence-based training programs like the FIFA 11+ to improve movement mechanics and reduce non-contact lower-limb injuries.
- Data-Driven Training: Utilize smart wearable technology and precise cardiorespiratory assessments to provide high-quality, personalized conditioning plans, helping members track and optimize their performance.
- Community-Centric “Third Space” Environments: Rethink the physical layout of the gym, combining fitness with social interaction and high-quality recovery options to foster deeper member engagement and long-term loyalty.
By implementing these strategies, fitness business operators can build highly resilient, science-based business models. Grounding operational decisions in rigorous sports science and smart financial metrics allows commercial operators to leverage global athletic excitement to drive sustainable, long-term business growth.